
2016 really was a year of two halves. Awful weather in the first 3 months really hit the participation and as a result the on course retailer struggled. Five named storms between January and March meant courses were closed across the land with some not seeing any play for over 8 weeks. Keen golfers still wanted to get their golf fix but went to the off course stores and ranges to see what was going on.
By the end of April the on course market was 4.5% down in value while the off course was racing away at 13.8% up. By the end of June the on course was still down 2.77% while the off course was still up over 10%
Fortunately the second half of the year saw an amazing turn around with great weather and lots of play. The off course still maintained its strong position and the on course managed to recover to just 0.5% down on the year. This was a great result all round and showed one of the strongest H2 performances seen for a long time. Overall market ended up at +5.3% in value terms v 2015.
Performance was mixed across the categories with the off course having an amazing run on clothing. Here the overall changes at the end of the year.

The relative differences in performance meant there was a shift to the off course for a the first time in a few years. Overall the on course still had the largest split of sales but this had reduced to 54.6% down from 57.8% the year before.

It was the same story across all categories except trolleys with the biggest change coming in apparel with the off course growing from 31.8% to 37.8% of the total market. Trolleys actually saw a small decline.
So how did consumers spend their money?
Overall spend saw a slight change in the overall priority of the categories

Woods and irons are still the top two categories, Footwear took the number 3 spot for the first time – overtaking balls. Tops was the biggest clothing category with putters being the smallest of the tracked categories accounting for 3.5% of spend. Hardware accounted for over 41.8% of total spend.
How did spend compare to last year?
2016 saw some big changes with 3 of the tracked categories seeing double digit growth. Biggest mover was bottoms at over 14% growth, followed by wedges and shirts.
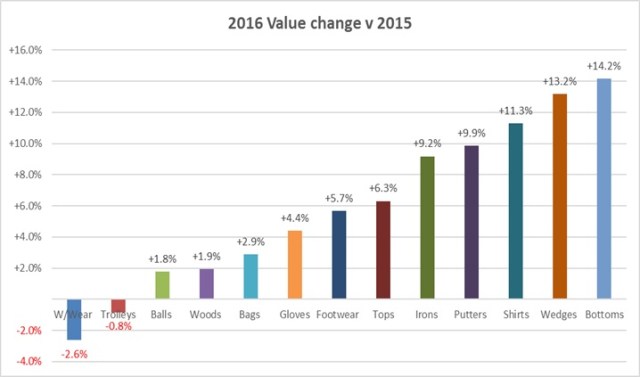
Biggest looser was weather wear seeing a 2.6% drop in sales. Trolleys also had a small decline – otherwise it was growth from all the categories.
What drove the changes?
Main driver for the market changes in all the hardware categories was an increase in ASP. Putters saw the biggest gains ending the year up 19.4%, with irons up 10.5% and woods up 8.7%. Many of the changes were the effect of sustained drops in the £ v the $. Brands facing increasing costs had to put prices up to the retailers on big ticket items.
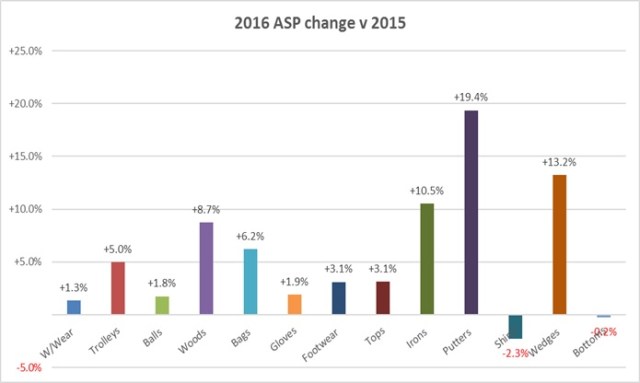
Interestingly two of the biggest movers – shorts and bottoms saw slight ASP drops – was promotion used to drive the increased sales?
Big changes in ASP lead to some decreases in units.
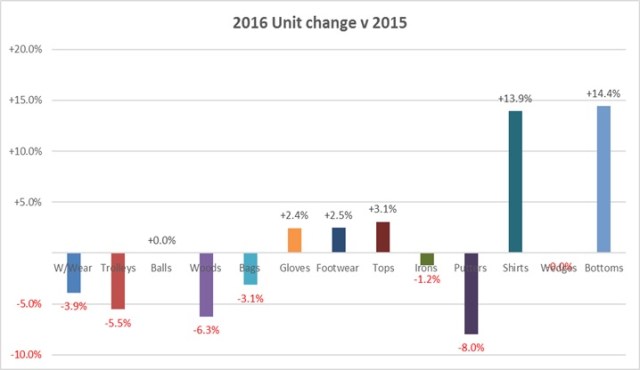
Declines were seen in 7 categories – mainly hardware or big ticket items. The biggest increase in ASP was met with the biggest drop in units, Putters we down -8%. Average price of a putter had got up to £130. No longer the item you change on the turn.
All in all 2016 was a topsy-turvy year that saw a great performance from the off course and a par save from the On.
