Well, after a lot of talking and an extraordinary election before the Summer, the negotiations are underway. So, what have we learnt following the June 2016 referendum?

Well, after a lot of talking and an extraordinary election before the Summer, the negotiations are underway. So, what have we learnt following the June 2016 referendum?
I am a little behind this month but thought it important to get another market update out to comment on what happened at the end of summer (August data). I will be doing another one at the end of the month so will keep this short and sweet, here goes.
August was a big month, and looks like it will be the second biggest of the year, with more than 10% of annual sales falling in the last month of the Summer holidays.
Initially, the stats look a little confusing. Overall market value is up 12.1% versus 2016. However there is a big difference On-, and Off-course this month, and not all categories are up. Also, On-course ball volumes – a good indicator of participation – were down this month -1.1% , which usually indicates that there might be some fall in sales.
So what happened in the key categories?

Well, On-course was up across the board. Clubs were up a staggering 29.8% while consumables were up a mere 4.4%. Off-course saw some gains – up 3.7% overall and 5.9% in Clubs. However Apparel was down -12.5% and consumables -2.8%.
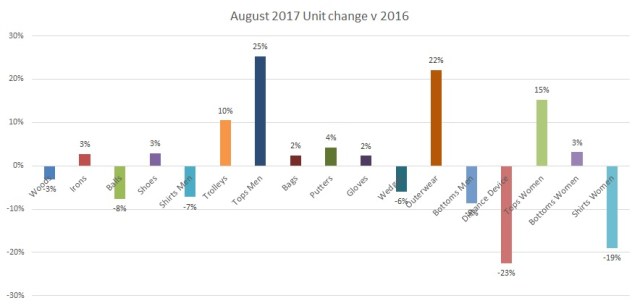
The other interesting point is that On-course Outerwear was up 27.6% in units. So I think we can assume that those golfers that did play, needed some weather protection.
Why are clubs up so much On-course?
Long and short of it, the On-course has really benefited from the recent Ping Launch of the G400. Perhaps we should call this the “Ping effect” or, with the current model, nomenclature the “G Effect”. I talked about this a couple of years ago with the G series and history has repeated itself. It looks like some pent-up spending has been unleashed and while the customers were in the shop they have bought clothing and other items as well. This has to be the main reason for the huge spike in sales, as weather and participation would appear to have been poor – so customers needed a reason to get to the shops.
Crazy stat!
I don’t usually pick out any specific products but the G400 is an interesting story this month. Looking at the raw data for every £100 spent in the On- and Off-course speciality golf shops, £8 was spent on either a G400 iron or a G400 wood – WOW that’s some launch!
So how did this effect the general mix of sales?
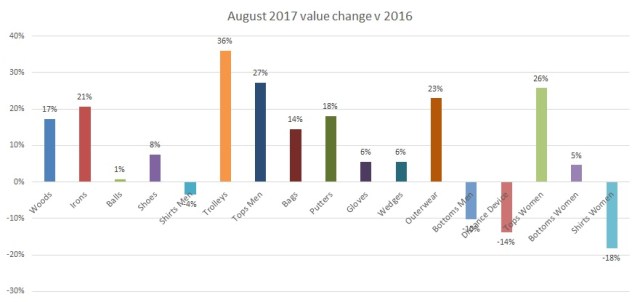
General mix is similar to other months. However, woods and irons have both taken a bigger share of the spend this month, with hardware accounting for 42% of sales versus 38% in June, and 39.5% in August last year.

Overall sales were up in 13 or 17 categories. Shirts collectively were the biggest looser along with men’s bottoms and distance devices. It appears that the spend on big ticket woods and irons pulled attention away from the higher value tech products.
So was all this growth just from ASP (like most of this year)?
ASP is well up across the board with huge gains in woods trolleys and irons. However most of the clothing categories are pretty static with a year ago.
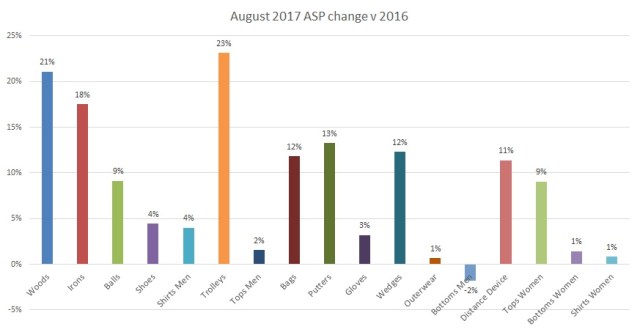
High ASP’s might be hurting distance devices. They are well down in units, but otherwise most unit sales are middling to flat, (except the obvious apparel that’s been hit by the weather). Woods were down slightly this month which is better than previous months. Irons were actually up even with the 18% increase in price.
How does this look for the rest of the year?
Well, the trend is pretty well set this year for solid growth. Previously I was calling between 8 and 10% and this is looking pretty safe. One of the key determinants was how well the product launches from the key brands went in H2. Ping has obviously done very well and Titleist have also made up some ground. Looking at this momentum double digit growth year on year is well on the cards.
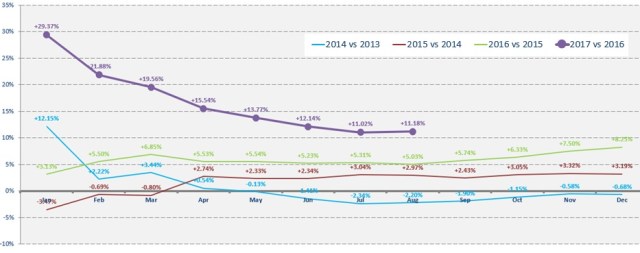
Sales growth v last year.
Next month the picture will be a bit clearer and we can see if the trends continue with strong On course sales.
