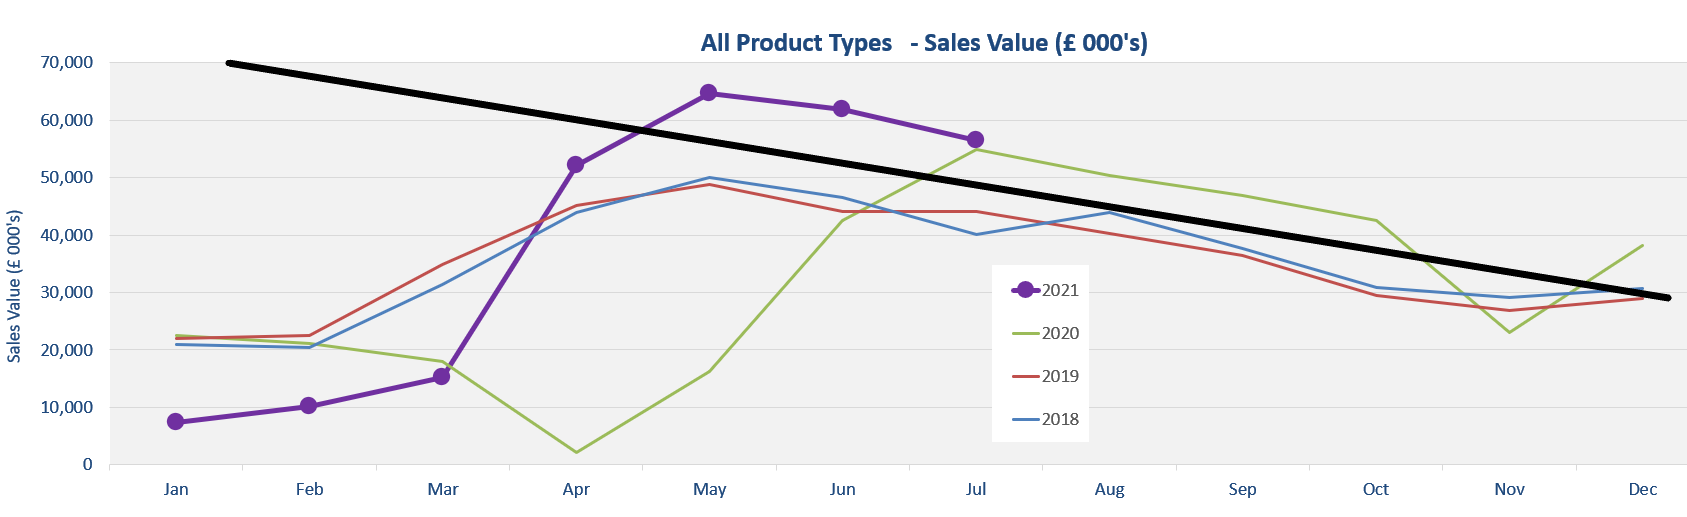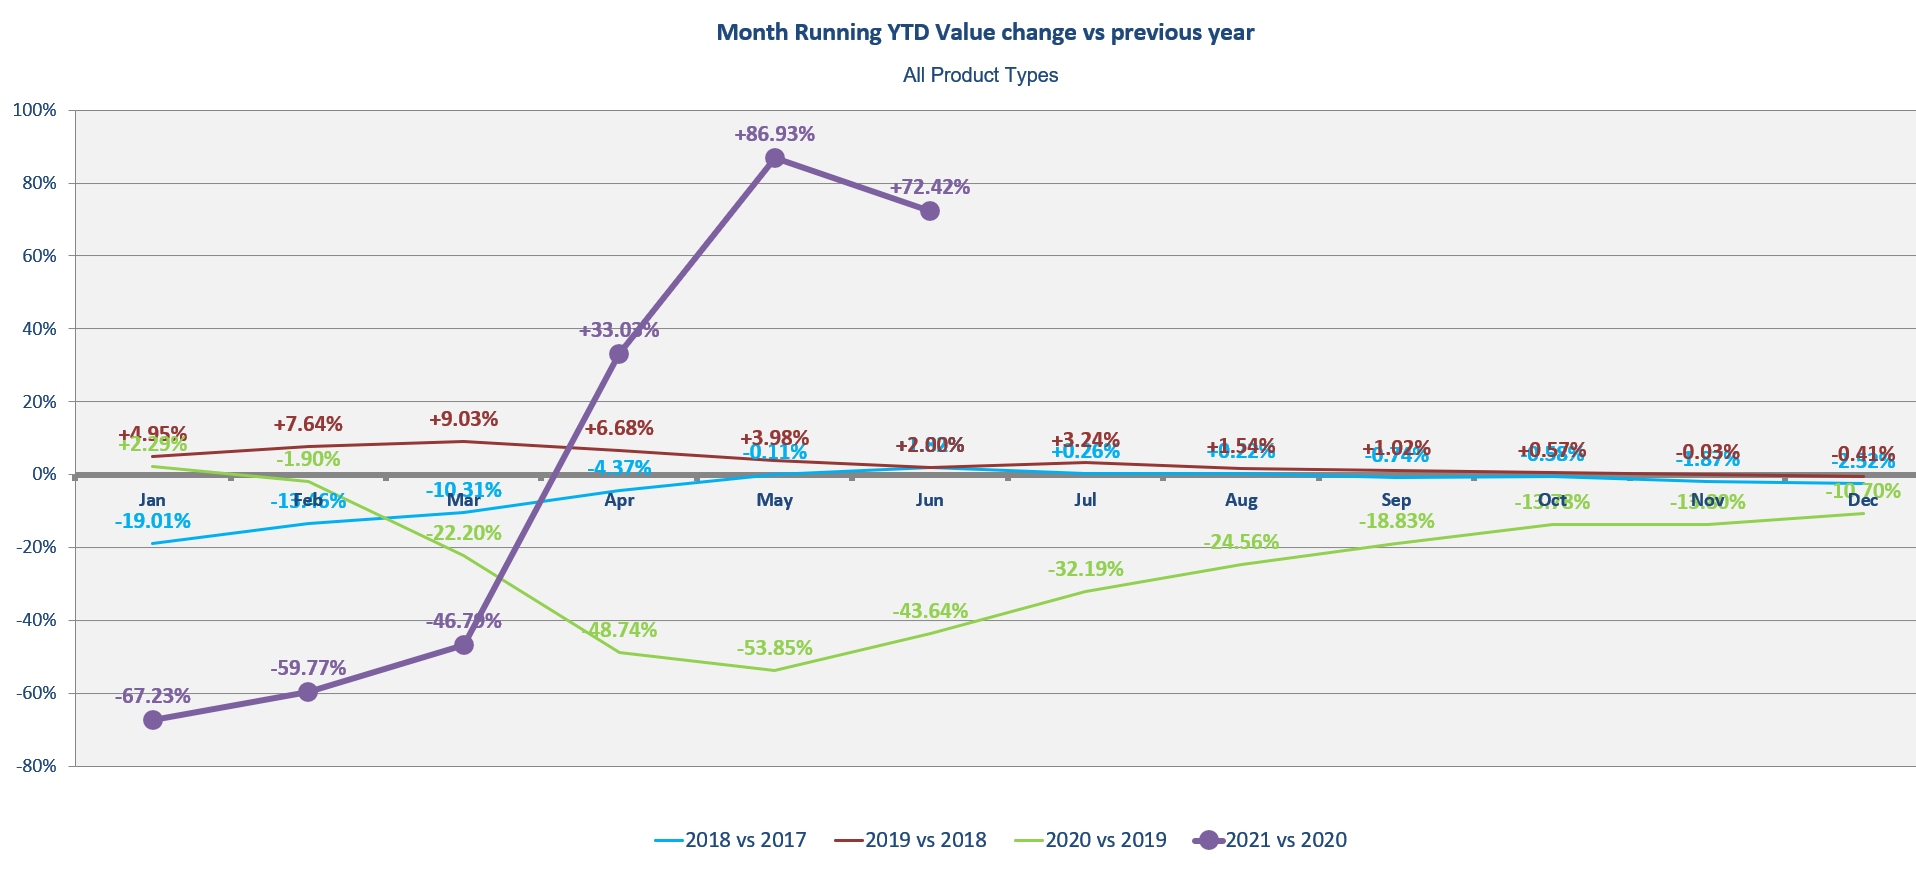
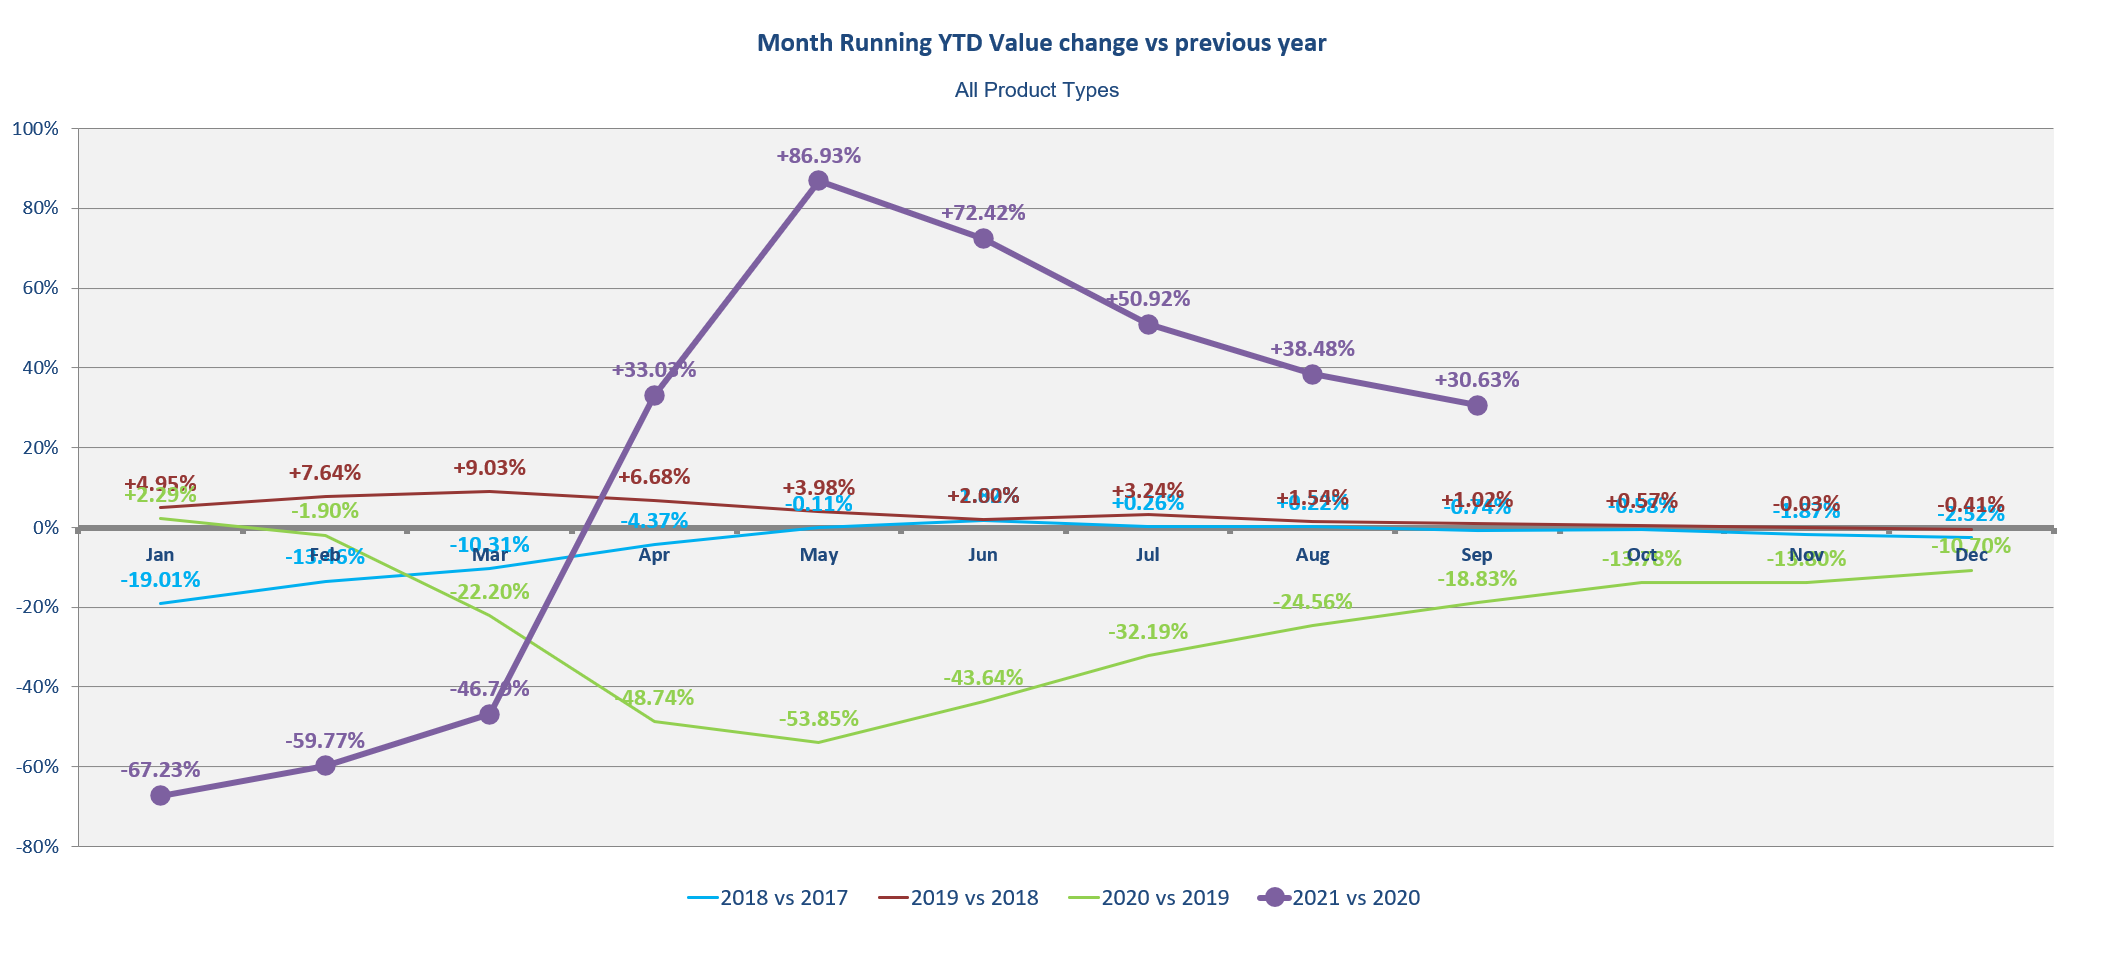
As we head towards the end of the year, it’s a good time to reflect on what has happened during the main sales season. September is the last of the big months and the end of Q3. A strong year to date has set us up for good year-end and thoughts for 2022 are very present. Following significant momentum in Q2, which set a number of records, September finished off Q3 well. While on the annual basis only July was up on 2020, September was still a good month. In fact, at the end of Q3, the total market value was 30% up year to date on 2020 and, more significantly, over 6% up on 2019.
While these numbers were strong they come at a time when the industry has faced some significant challenges. While there was no lockdown to prevent people playing golf, life has started returning to normal. As a consequence, there has been fewer golfers playing the game. As we can expect, the drop off has been bigger during the week than the weekend, which appears to have remained strong. The question for everyone at this point is, where will the tide set? Will it remain higher than it was or return to 2018/2019 levels.
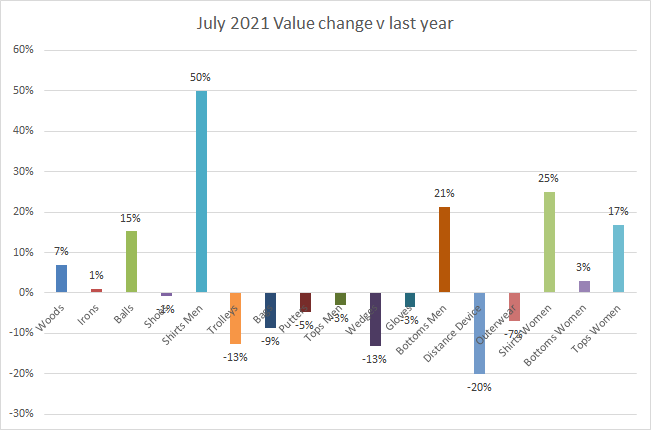
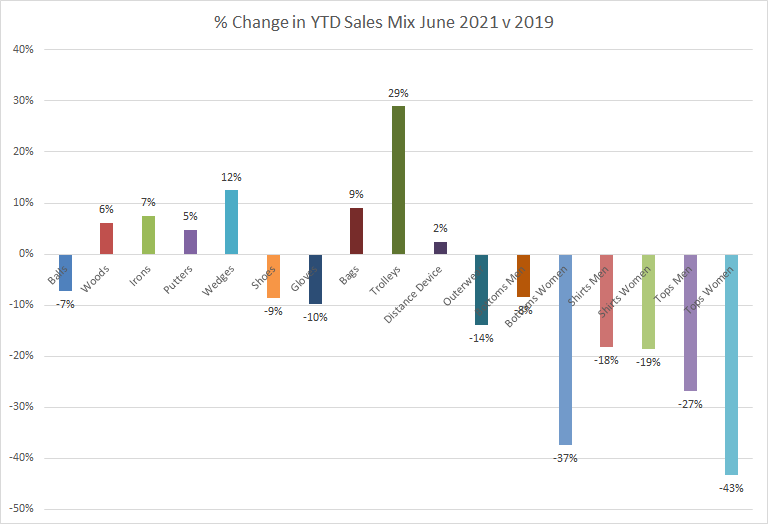
Another significant challenge for the industry has been inventory. Not everything is within our control and shipping and factory closures in the East have provided a major challenge. The worst hit category this year has been Irons which has been the largest product category, year to date, for the last 3 years. Inventory is currently 25% down on 2020 and a staggering 48% down on 2019! This has hit sales and is illustrated by the fact that the Woods category has over taken Irons in the product mix this year.
While all categories are well up on 2020 this year with double digit growth, Apparel is still struggling in the longer term context. The lack of visitors is probably to blame for this and has meant that Apparel is 20% down overall versus a normal year of 2019. The affects of this drop will have been felt differently by brand depending on where they sell most of their products.
Value, Volume and ASP
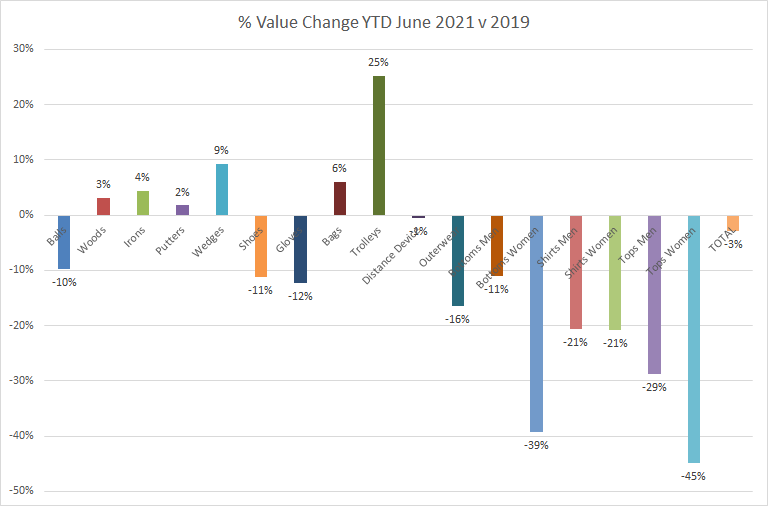
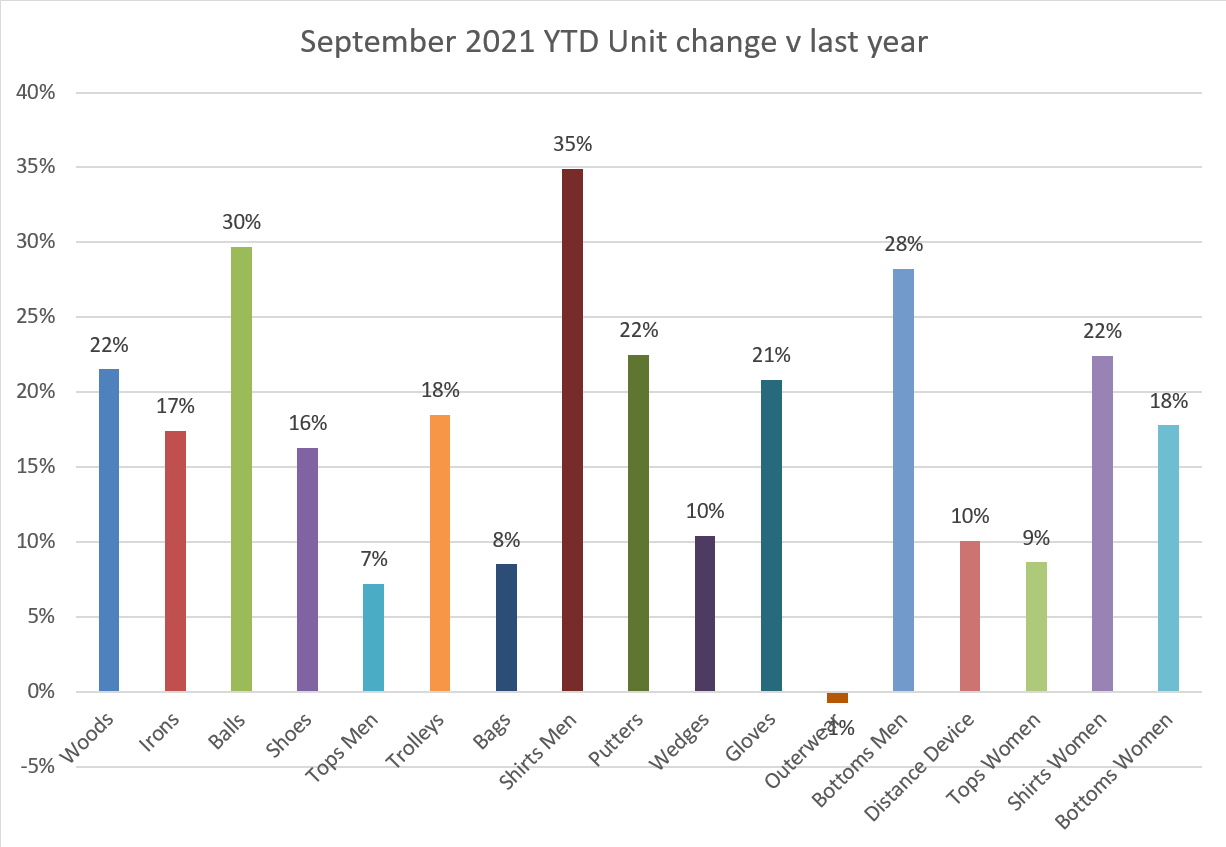
Year to date value is up in all categories.

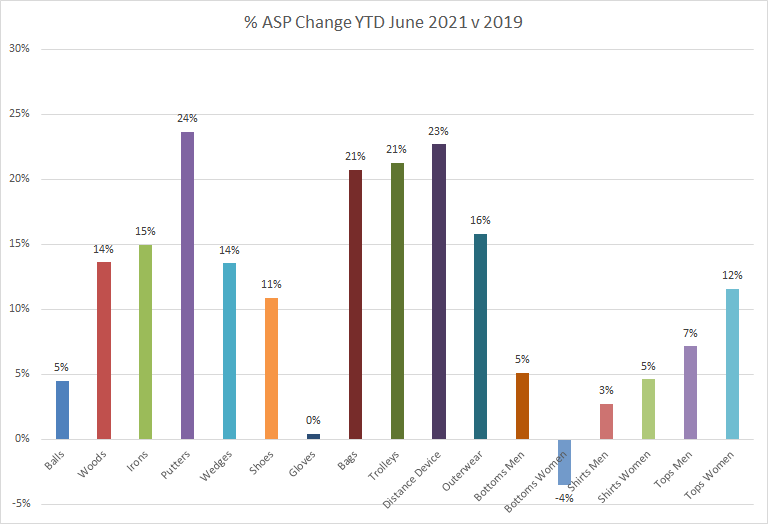
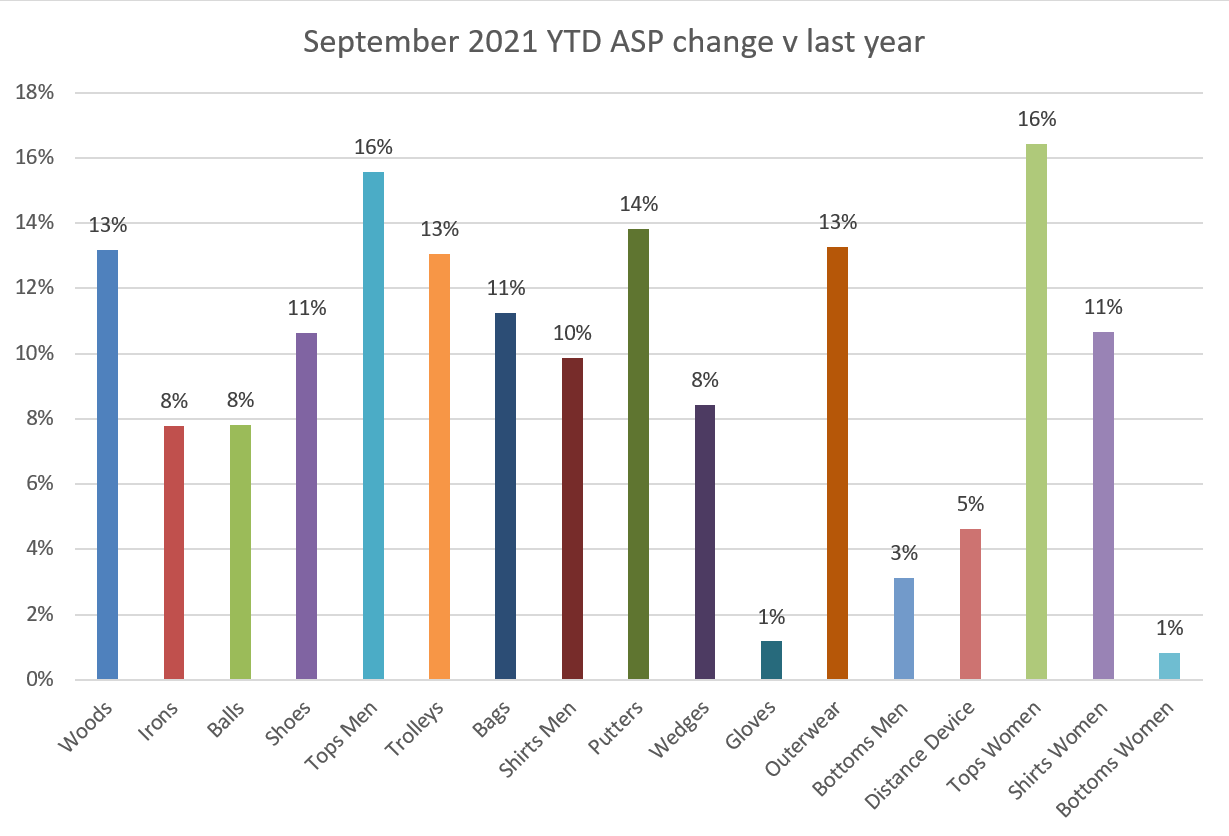
Value has been driven by both Average Sales Price (ASP) and Volume for most categories. ASP’s have seen a dramatic increase and are up in every single category YTD versus 2020 and all but one are up versus 2019. Interestingly, 5 of the 7 Apparel categories have seen prices rise over 10% versus 2020.
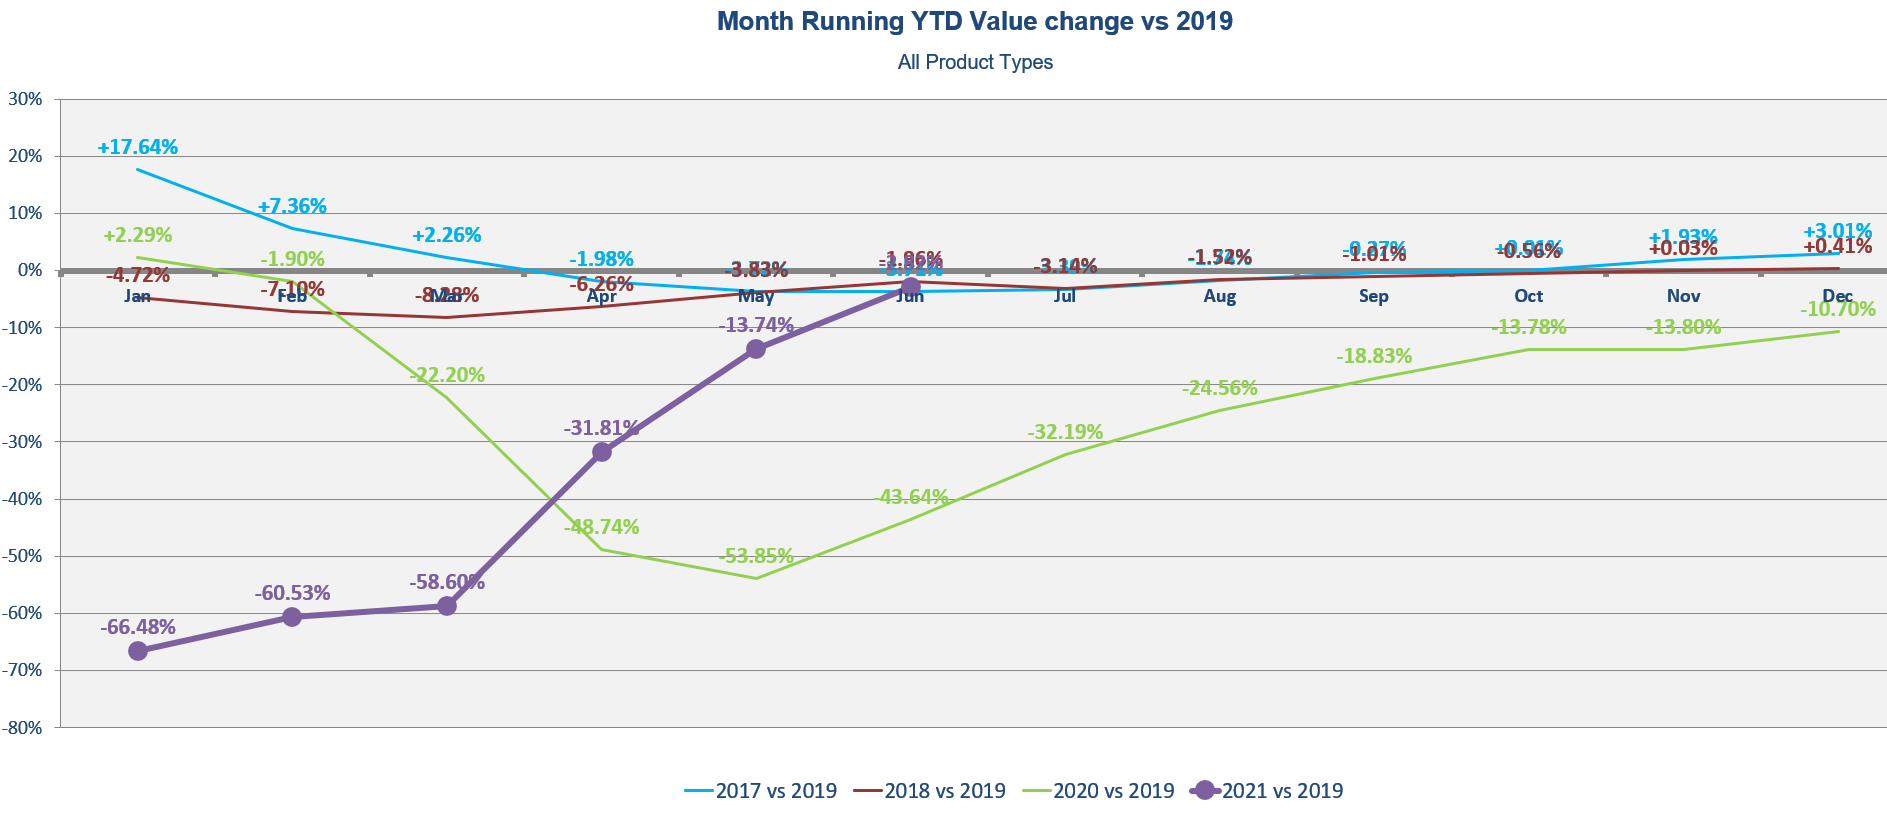
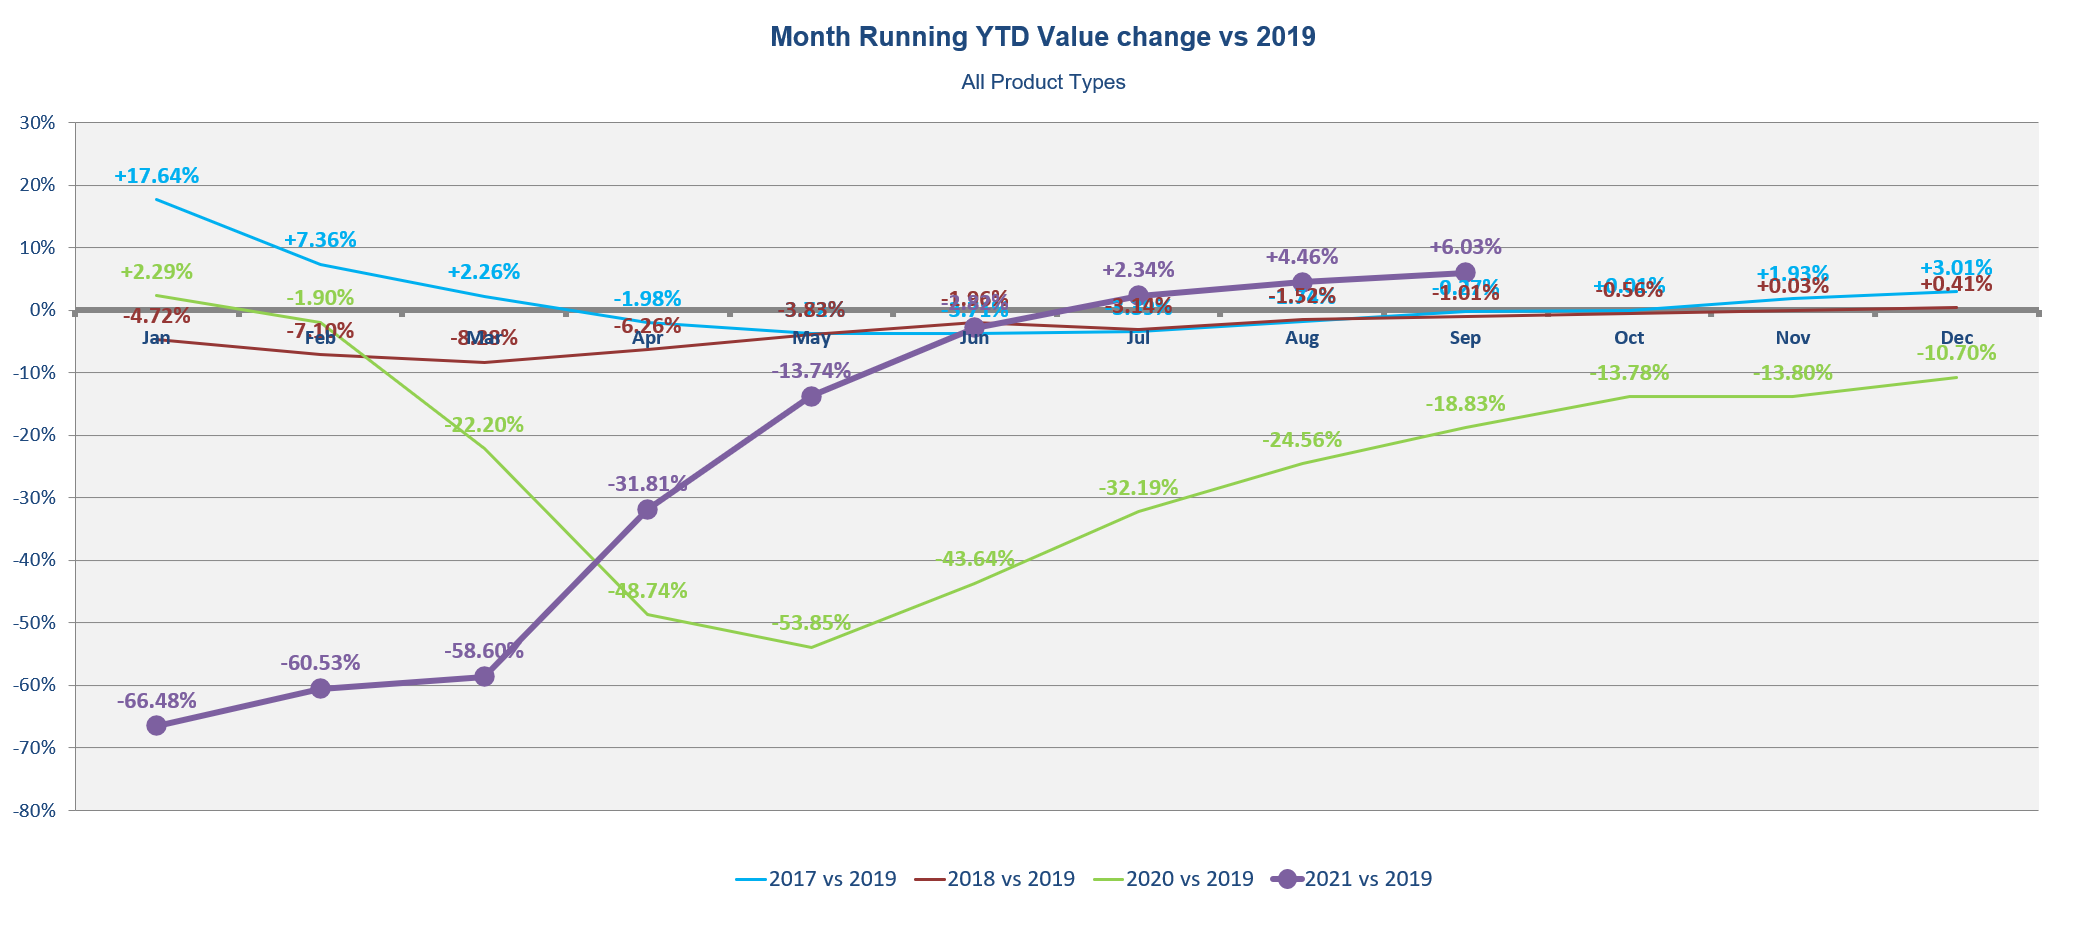
Versus 2019, the trend is a little different with Clubs all being up – except for Putters. Balls are up and so are Trolleys. However Apparel is still lagging far behind so there is lots of opportunity for further growth.
How does this help me for next year?
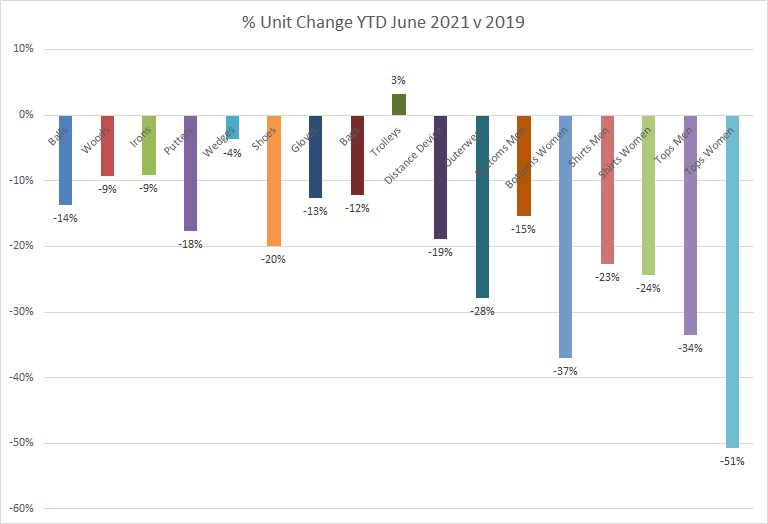
Well, the main challenge for everyone in the industry is making smart decisions on what to buy for next year. Buy too much and tie up cash and be forced in to clearance. Don’t buy enough and miss out on sales. With the way things are going we should show some solid growth for 2021 versus all years. This has been driven by Value more than Units in most instances. So, it’s important that we factor this in to our planning.
While we have reached a new market high, we should also consider if there are any factors that may reverse this?
We appear to be through the worst in terms of COVID. While the numbers are high, the vaccination program has enabled the economy to get back up and running. As a result high numbers are not creating the impact on the NHS that had occurred before the vaccines. We can’t be complacent but all being well, things seem to be manageable. As a result of this we should hope to see more visitors next year which will boost some areas of the economy and increase sales. However, it will also lead to more UK residents going on vacation and spending some of their money else where.
In general, the economy seems to be ticking over ok with the only real issue being supply driving prices and creating inflation. This could cause some issues and might create some negativity. This said, I think we can be confident that we are in a better place than we could have hoped for 18 months ago. As a result, I would hope that next year’s forecasts could be built on numbers that reflect a more normal year, such as 2019, with some single digit growth representing the new tide level.
Looking at stock levels now, retailers have more than they did in 2020, except for in Irons. However, stock levels generally are lower than 2019. There are some exceptions to this with Balls, Trolleys and Distance Devices up double digits on 2019 in terms of units – predominantly driven by the off course retailers.
Leaner stock levels of the last few years have improved margins and reduced clearance. This is better for retailers. What we don’t want to do now is to create a situation where a lack of stock this year creates some panic and then over purchase for next year. The other factor to consider is how an individual’s business has changed over the last couple of years. Hardware has been on a role – do we expect that to continue at the same levels for 2022?
With all this, we can draw some conclusions. Even with the chaos of the last 2 years, the status quo should not end up all that different when it comes to UK golf retail. Taking a longer term view, we haven’t seen huge change across the industry. However, certain categories have seen changes and online retail has done well. This has led to a shift in many businesses and Total Sales remain in a relatively predictable range.
Assuming growth this year, the figures for Total Value for all years since 2017 have been plus or minus 10% of 2019 sales, which was the last normal year. For most people, their plans probably don’t need to be outside of that range. Again, we are talking averages, and with all things, you need to consider how far from the average you are, and how this might impact you. The obvious exceptions to that are businesses that have an extreme bias in their trading, eg. resort courses or sole apparel brands.
Companies focused on specific categories will need need to pay more attention to what is happening in their particular market.
Whatever is ahead of us, I think we can be confident that it should be less chaotic in 2022 than the last two years. How companies perform is largely down to how they react to the challenges thrown at them and not what the market dictates.